Retrofit & economics
The retrofit measures low: nine causes, in the order worth checking
When a completed retrofit fails its lux survey, the fault is as often in the measurement as in the installation. The meter class problem, warm-up drift, reference plane errors, and the design assumptions that quietly did not survive to site.
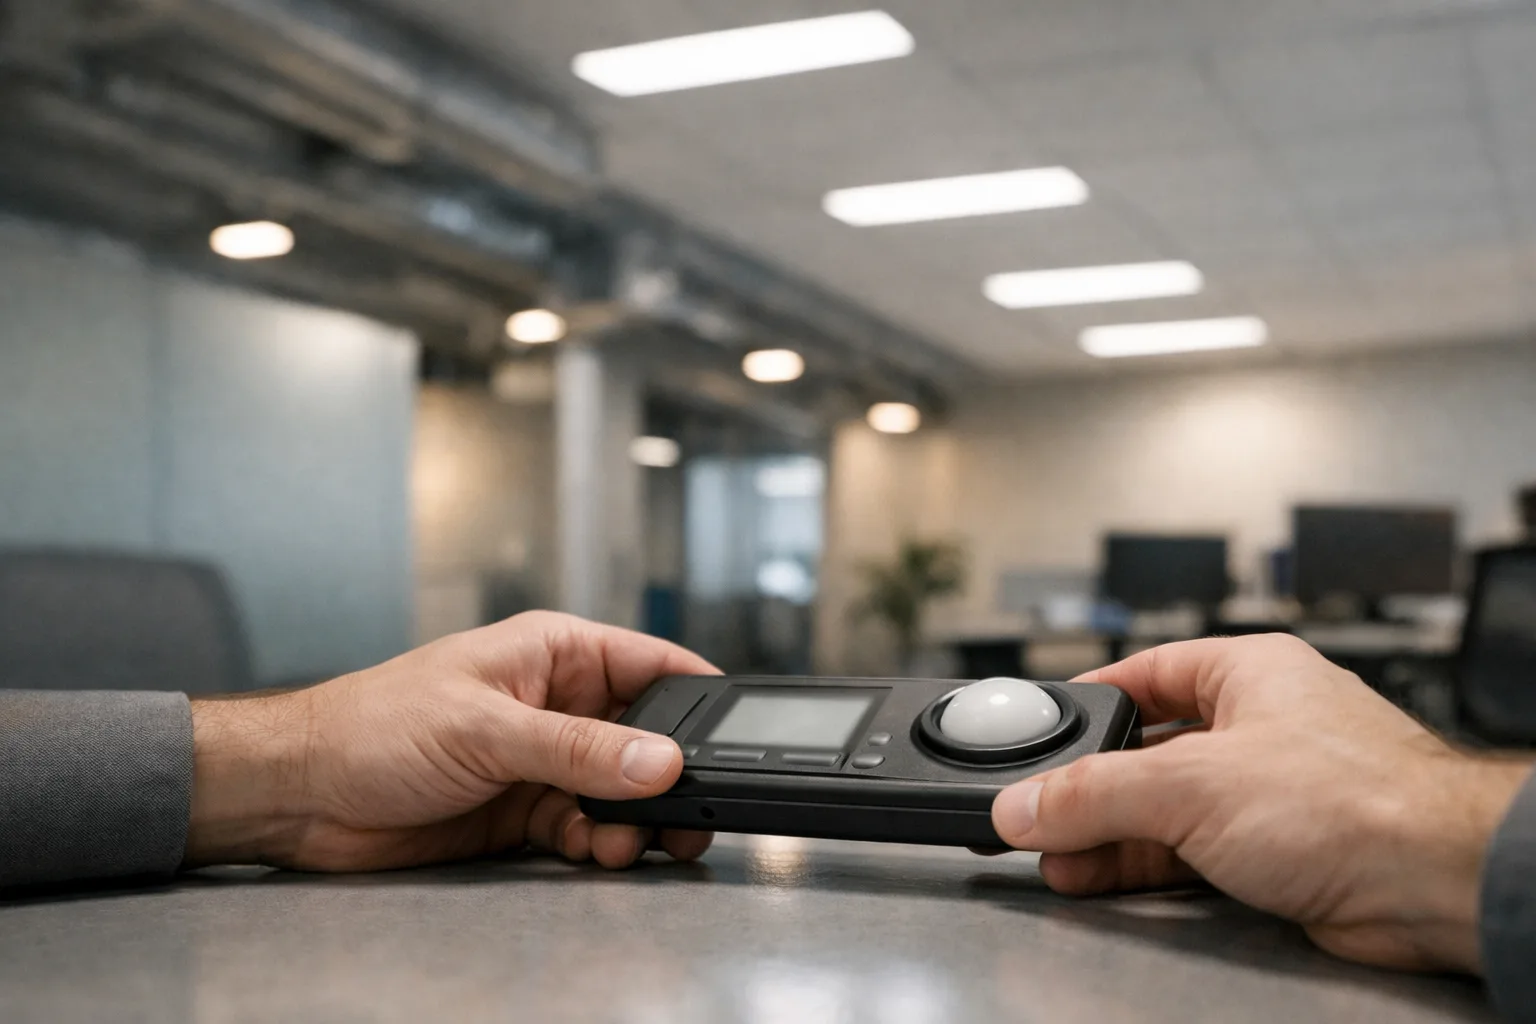
A survey comes back below target and the argument starts. Before anyone apportions blame, work through this list in order — the first four causes are measurement errors, they are the most common, and they are free to eliminate.
Causes in the measurement
1. The meter is the wrong class for LED light
This is the one nobody expects and it can account for a double-digit percentage on its own.
A lux meter's sensor must approximate the eye's spectral sensitivity, V(λ). How well it does so is quantified as f1′, the spectral mismatch index, and it is the basis of the meter classification in DIN 5032-7 and CIE 69 — class L / A being the best, class C the loosest. Cheap meters have poor V(λ) correction, and many were calibrated against an incandescent source whose smooth spectrum flatters them.
LED spectra are not smooth. They have a blue peak and a phosphor hump, and a sensor with poor spectral match responds to that shape differently than to incandescent. The reading can be out by a substantial margin in either direction, and it varies with the CCT of the source — so the same meter can read one product high and another low.
Establish which meter was used, its class, its f1′ figure, and when it was last calibrated. A survey taken with an uncalibrated phone app or a hardware-store meter is not evidence of anything. If two parties disagree, measure the same points with both meters — the gap between them is usually the whole dispute.
2. Measured before thermal equilibrium
LED output falls as the junction heats. From cold switch-on to steady state the drop is real and can be several per cent, more in a poorly heatsinked fitting or a hot ceiling void. Survey immediately after switch-on and you record a number the installation will never sustain — and if the commissioning survey was taken cold while the dispute survey was taken hot, the two are not comparable.
Allow at least 30 minutes at operating condition, in the actual mounting, and record the time since switch-on on the survey sheet.
3. Wrong reference plane
Task illuminance is specified on the task plane — typically 0.75 m above floor for desk work — not at floor level. Measuring on the floor and reporting a fail is a procedural error, and it is the single most common cause of a disputed handover reading. The specification should have named the plane; if it did not, that is the first thing to fix.
4. Daylight contamination, in both directions
A survey taken with blinds open on a bright day passes installations that should not, and a survey taken at dusk in a space with a daylight-linked control system records a system doing exactly what it was designed to do. Survey after dark with blinds closed, or measure the daylight contribution separately and subtract it. Note the condition on the sheet either way.
Causes in the design
Before reading further, check which quantity is short. An average that meets target with dark patches between fittings is a uniformity failure and has different causes and different remedies from a genuine shortfall in level — the distinction is set out in uniformity and the compliant average.
5. Maintained illuminance read as an initial value
If the design targeted a maintained illuminance and applied a maintenance factor, the day-one reading should be above target, not at it. A handover survey that lands exactly on the maintained figure has already lost its margin and will be non-compliant within the maintenance cycle. Conversely, if a design omitted the maintenance factor entirely, it was under-specified from the start. See maintained versus initial illuminance.
6. Module flux used instead of luminaire flux
A calculation run with the LED module's output rather than the finished luminaire's overstates delivered light by whatever the optics and diffuser absorb — routinely 10–20%. Check which figure went into the calculation, and check it against the input watts in the IES file.
7. Assumed reflectances that the building does not have
Calculations are commonly run at reference reflectances — a bright ceiling, mid walls, mid floor. Then the architect specifies a dark ceiling, or the space is a warehouse with black racking floor to ceiling. Utilisation factor falls sharply and the installed result lands well under the calculation. Re-run the calculation with the finished surfaces before concluding the fittings are at fault.
Causes in what was actually installed
8. Distribution changed even though lumens did not
Particularly after a tube swap. A narrower distribution puts more light directly under the fitting and less between fittings and on vertical surfaces. The average can hold while uniformity collapses and the room reads as darker. Survey on a grid, not at convenient points — a grid reveals the pattern, spot readings under the fittings hide it. See tube swap versus luminaire replacement.
9. Value engineering, obstruction and dirt
Three quieter possibilities, all worth checking against the drawing:
- Fewer fittings than calculated. Count them. Reductions agreed during procurement do not always make it back into the calculation.
- Obstruction that was not modelled. Racking, ductwork, partitions, mezzanines. A calculation run on an empty box does not describe a fitted-out building.
- Dirt already, or protective film still on. On a refurbishment in a dusty environment, fittings can accumulate meaningful losses before handover. And more than one shortfall has turned out to be transit film left on diffusers.
A survey that will not be argued with
- Meter identified by model and class, with calibration date, and f1′ stated.
- At least 30 minutes at operating condition before the first reading; time recorded.
- Reference plane stated and set consistently, on a tripod or a fixed stand rather than held.
- Regular grid across the area, spacing recorded, with task areas identified separately from surroundings.
- Daylight condition recorded — after dark, or with the daylight contribution measured separately.
- Controls set to full output, and stated as such, so a daylight-linked system is not surveyed while dimming.
- Average and minimum reported, so uniformity can be computed rather than inferred.
Seven lines on a cover sheet. They convert a lux survey from an opinion into a measurement, and in our experience they resolve most shortfall disputes before anyone has to look at the luminaires at all.
Sources and further reading
- DIN 5032-7 and CIE 69 — classification of illuminance meters and the f1′ spectral mismatch index.
- EN 12464-1 — reference plane, task area definition, uniformity requirement and the verification approach.
- CIE 97 — maintenance factor, and therefore the relationship between a handover reading and a maintained value.