Metrics & standards
Reading an IES file, and the four checks that catch a fabricated one
What each field in an LM-63 photometric file means, how to verify the declared flux and efficacy against the candela data, the difference between a measured and a simulated file, and the scaling trick that turns one test report into a whole product range.
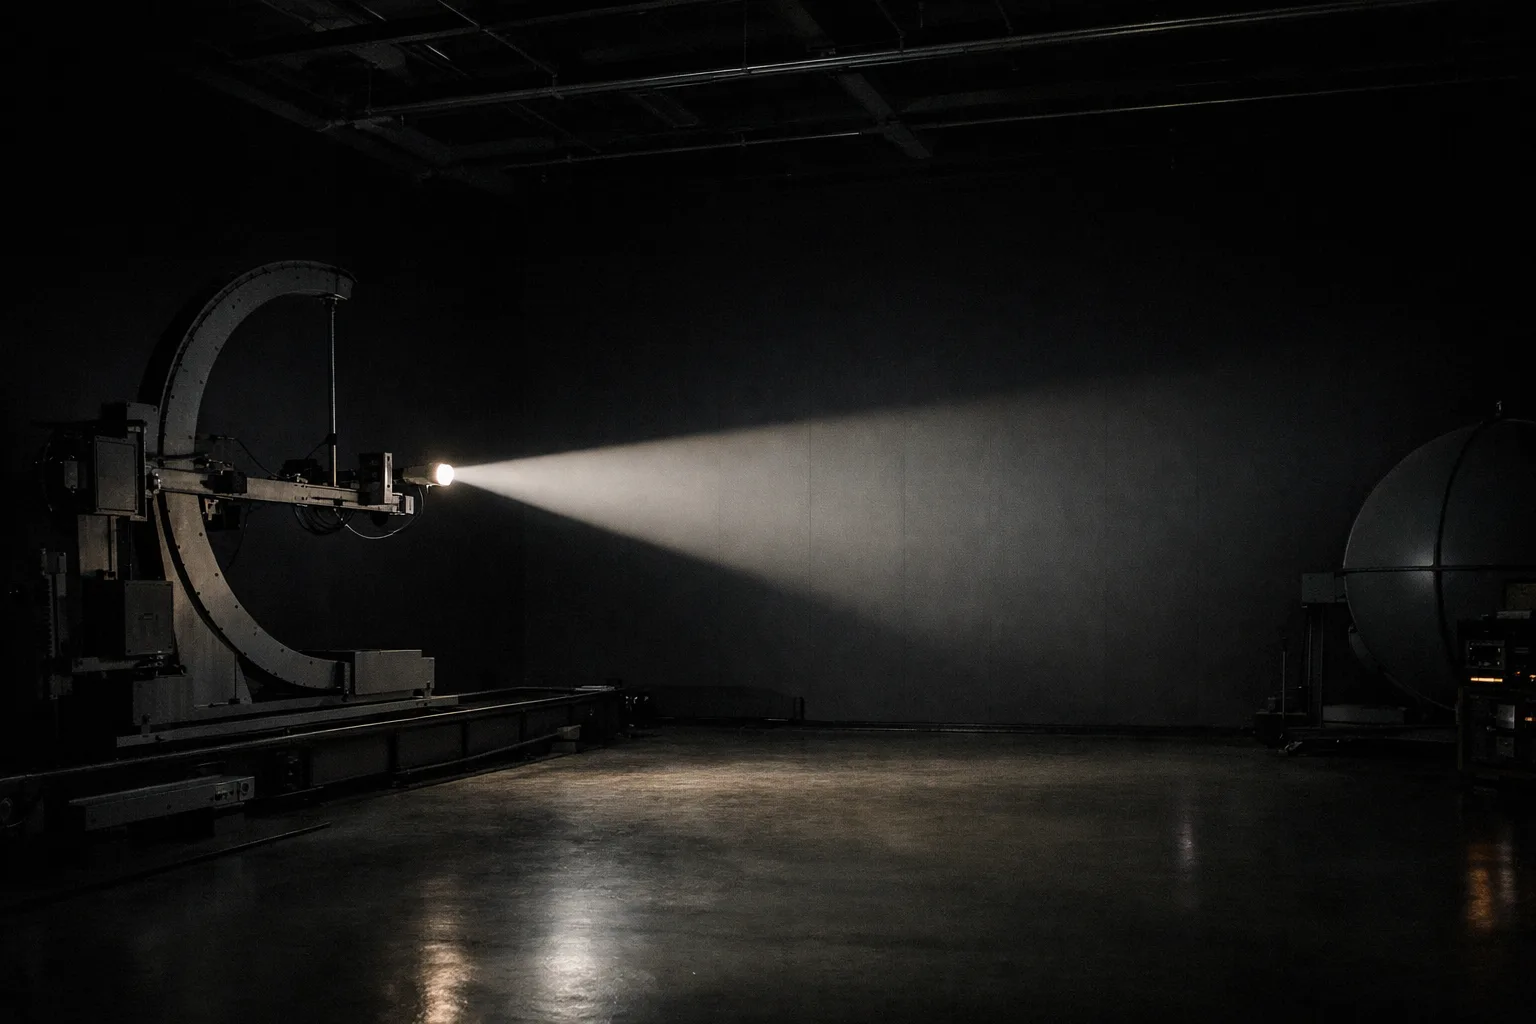
The IES file is the only part of a supplier's documentation that cannot easily lie to you, because it contains the raw candela distribution and everything else can be derived from it. It is also plain text, which means the checks below need nothing more than a text editor.
The structure, top to bottom
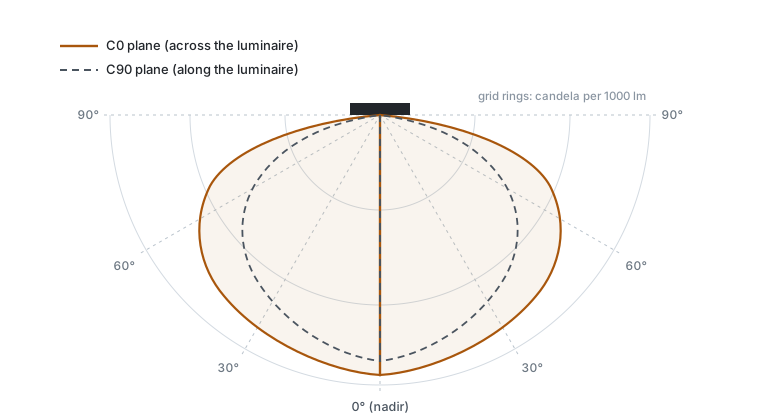
An LM-63 file is ASCII in a fixed order: keyword header, a TILT line, two lines of numeric parameters, then the angle sets, then the candela values.
IESNA:LM-63-2002
[TEST] TR-2026-0417
[TESTLAB] Name of the laboratory
[ISSUEDATE] 2026-04-17
[MANUFAC] Manufacturer
[LUMCAT] Product catalogue number
[LUMINAIRE] Description
TILT=NONE
1 -1 1 37 1 1 2 0.6 0.6 0.1
1.0 1.0 28.4
0 5 10 ... 180
0
1240 1235 1210 ...
| # | Field | What it should say |
|---|---|---|
| 1 | Number of lamps | 1 for an LED luminaire measured as a whole |
| 2 | Lumens per lamp | −1 signals absolute photometry — the candela values are real, not normalised |
| 3 | Candela multiplier | Should be 1.0. Anything else means the data has been scaled — see below |
| 4 | Number of vertical angles | Resolution of the distribution; more is better, very few suggests a coarse or synthetic file |
| 5 | Number of horizontal angles | 1 = rotationally symmetric; several = asymmetric distribution |
| 6 | Photometric type | 1 = Type C, normal for architectural luminaires |
| 7 | Units type | 1 = feet, 2 = metres |
| 8–10 | Luminous opening width, length, height | The physical size of the emitting area. All zeros means it is being treated as a point source |
The second numeric line is ballast factor, a legacy field, and input watts. That last number is the one that makes the whole file auditable.
Check 1: does the efficacy work out?
An absolute-photometry file contains both the flux (integrated from the candela data, and usually stated by the manufacturer) and the input watts. Divide one by the other.
Compare that against the datasheet's headline lm/W. They should agree. Where they do not, the usual explanation is that the datasheet quotes LED package efficacy while the file describes the finished luminaire — which is exactly the gap the file exists to close. A datasheet claiming substantially better efficacy than its own photometric file is quoting a different thing.
Check 2: is the candela multiplier 1.0?
A multiplier other than 1.0 means every candela value in the file is being scaled by software rather than measured. There are legitimate uses, but the common illegitimate one is this: a manufacturer measures one luminaire, then produces the "3,000 lm", "4,000 lm" and "5,000 lm" variants of the same product by scaling the multiplier, without measuring any of them.
That is fine only if output really is the sole difference and the optics, thermal behaviour and drive current genuinely scale linearly — which they do not. Higher drive current means higher junction temperature, which means lower efficacy and a shifted colour point. A scaled file quietly assumes all of that away. If a whole product family shares one test report with different multipliers, ask which variant was measured and treat the others as estimates.
Check 3: is there a test laboratory and a date?
[TESTLAB] and [ISSUEDATE] are the difference between a
measurement and a simulation. Optical design software will export a perfectly
well-formed IES file from a ray-trace model that no physical luminaire has ever
been built from — useful during development, not evidence of anything.
Three signs a file is synthetic rather than measured:
- No
[TESTLAB], or a lab field naming the manufacturer's own design department. - No
[ISSUEDATE], or a date preceding the product's release. - Suspiciously smooth data — real measurements have small irregularities; ray-traced output can be implausibly clean.
For anything being specified, ask whether the file is from an LM-79 test and who performed it. An independent laboratory report costs the manufacturer money, which is precisely why its presence is informative.
Check 4: does the luminous opening make sense?
Fields 8 to 10 give the physical dimensions of the emitting area. Zeros mean the file describes a point source, which is an acceptable approximation only when the calculation distance is large relative to the fitting.
It is not acceptable for a 1.5 m linear luminaire two metres above a desk, or for a luminous panel in a low ceiling. Near-field effects are exactly what the opening dimensions let the calculation software model. A large fitting declared as a point source will produce a calculation that is confidently wrong close to the luminaire — which is where the task area is.
Open the file in a text editor. Confirm: lumens-per-lamp is −1, candela multiplier is 1.0, input watts is present and divides into the flux to give the claimed efficacy, TESTLAB and ISSUEDATE are filled in, and the luminous opening is not 0 0 0 for a physically large fitting. If all five hold, the file is probably what it claims to be.
What the file cannot tell you
Chiefly, whether the measurement behind it was any good. The file loads either way; the evidence is in the report document, and what to check in it is set out in accredited, or just printed.
It is a photometric description and nothing else. None of the following are in it, and all of them belong in the specification separately:
- Colour rendering and chromaticity — no Ra, no R9, no TM-30, no SDCM. See CRI and TM-30.
- Flicker — the file is a static distribution and says nothing about time modulation.
- Lifetime — no LM-80, no TM-21. See lifetime claims.
- Glare in your room — a calculation package computes UGR from this file plus your geometry; the file alone has no UGR. See UGR.
- Thermal behaviour in situ — the test was performed under laboratory conditions that your ceiling void may not resemble.
What to require
- An IES file for the exact catalogue number being supplied, including optic and CCT variant — not for the nearest family member.
- Absolute photometry from an LM-79 test, with the testing laboratory named and the report available on request.
- Candela multiplier 1.0, or a written explanation of any scaling and which variant was physically measured.
- Luminous opening dimensions populated correctly for the physical fitting.
- Input watts in the file consistent with the datasheet — this single cross-check catches more overstated efficacy claims than any other question.
Sources and further reading
- IES LM-63, Standard File Format for the Electronic Transfer of Photometric Data — the file structure and field definitions.
- IES LM-79, Approved Method: Optical and Electrical Measurements of Solid-State Lighting Products — the absolute photometry test that produces a legitimate file.
- EULUMDAT (.ldt) — the European equivalent format; different layout, same principles and the same checks apply.