Metrics & standards
CRI 90 is not a colour quality specification, and TM-30 explains why
What Ra actually averages, the specific colours it omits, why R9 gets quoted separately, and how TM-30's Rf, Rg and colour vector graphic answer the question a single number cannot — which colours shift, and in which direction.
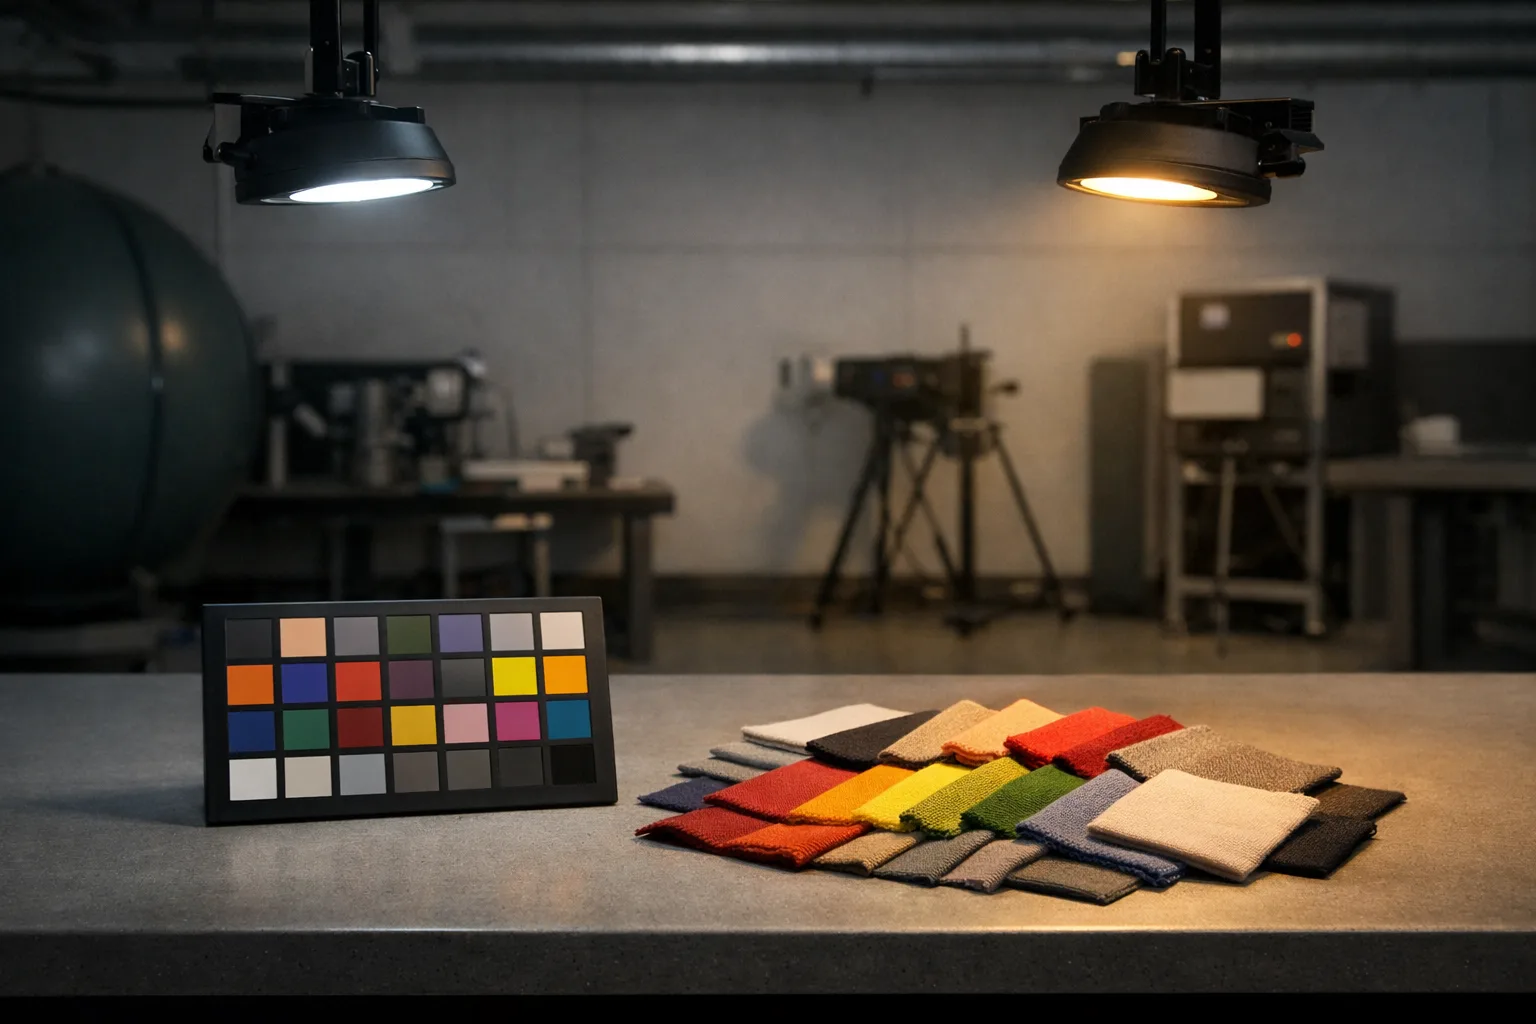
Two luminaires both declare Ra 90. One makes a retail display of red produce look appetising; the other makes it look grey and slightly brown. Neither datasheet is lying. The number simply does not measure the thing that differs.
What Ra is an average of
The general colour rendering index, Ra, is computed by illuminating a set of standardised test colour samples with the source under test and with a reference illuminant of the same correlated colour temperature, then measuring how far each sample shifts. Ra is the arithmetic mean of the first eight of those samples.
Those eight are all moderate in saturation — muted pastels. The strongly saturated colours live in the extended set, R9 through R15, and none of them are in Ra. Two consequences follow directly:
- Averaging hides outliers. Eight numbers averaging 90 could be eight values of 90, or seven values of 95 and one of 55. The second source has a visible, specific defect and the same headline figure.
- Saturated colours are unmeasured. Deep red is the classic case, which is why R9 — strong red — is so often quoted separately. White LEDs made with a blue pump and a broad yellow phosphor characteristically have a deficit in the deep red part of the spectrum, and Ra is blind to it.
Ask for Ra and R9 as a matter of course. R9 above 50 is a reasonable commercial threshold and above 90 is genuinely good; a supplier who will not quote R9 is usually declining for a reason. This is still a workaround for a metric that cannot express direction of shift — see below.
What Ra cannot express at all
A fidelity average answers one question: how far, on average, do colours move from the reference. It cannot tell you two things a specifier actually needs.
Which direction they move. A source that slightly increases saturation and one that slightly decreases it can score identically. Their perceptual effect is opposite: the first makes merchandise look vivid, the second makes it look washed out. Retail and food display live entirely in this distinction.
Which hues are affected. An average over eight samples cannot say that reds are fine and cyans are collapsing.
What TM-30 adds
IES TM-30 evaluates the source against 99 colour evaluation samples spanning real-world reflectance spectra with far better hue and saturation coverage, and reports several things instead of one.
| Output | Answers | Reading it |
|---|---|---|
| Rf | Fidelity — how close to the reference, on average | Conceptually similar to Ra but over 99 samples; higher is closer to reference |
| Rg | Gamut — does the source increase or decrease average saturation | 100 is reference-like; above 100 saturates, below 100 desaturates |
| Rf,hj / Rg,hj | The same, per hue bin (16 bins) | Localises the problem to a hue region instead of averaging it away |
| Colour vector graphic | Direction and magnitude of shift, per hue | Arrows pointing outward mean increased saturation in that hue; inward, decreased |
| Rcs,h1 | Chroma shift for the red bin specifically | The quantitative answer to the question R9 was a proxy for |
The colour vector graphic is the part that changes conversations. It is a single picture showing, for each of sixteen hue bins, how the source moves colours relative to the reference. A specifier looking at two products with identical Rf can see immediately that one pushes reds outward and the other pulls them in.
Neither metric tells you which is better
This is where TM-30 is routinely misused. Higher Rf is not automatically better, and Rg above 100 is not automatically better either — the application decides.
| Application | Priority | Reasoning |
|---|---|---|
| Print inspection, paint matching, textile QC, medical | High Rf, Rg close to 100 | Fidelity is the entire point; deliberate saturation is a defect |
| Fresh food, florist, cosmetics, apparel retail | Good Rf with controlled Rg above 100 in target hues | Modest saturation enhancement makes merchandise look its best |
| Offices, schools, general workplace | Solid Rf, Rg near 100 | Skin tones and printed material should look normal; nothing exaggerated |
| Industrial, warehouse, circulation | Meet the standard's Ra minimum and spend the budget elsewhere | Colour discrimination rarely governs; efficacy and glare do |
The efficacy trade-off, stated honestly
Better colour rendering costs efficacy. Filling in the spectral regions that a blue-pump-plus-yellow-phosphor LED under-serves — deep red in particular — means adding emission where the eye's luminous efficiency function is low, so more radiant power buys fewer lumens.
The size of that penalty depends on the package technology and changes with every product generation, so quoting a percentage here would be obsolete within a year and specific to a manufacturer besides. The reliable approach is to ask a single supplier for the same fitting in two CRI grades and compare the lm/W on their own datasheets. That comparison is real, current, and free.
A tender comparison that lists efficacy and CRI in separate columns invites a supplier to win on efficacy with an Ra 80 product against a competitor's Ra 90. If colour rendering matters for the space, put the CRI floor in the mandatory requirements, not in the scored criteria — otherwise you are scoring two different products against each other.
Two things that are not colour rendering
The first is chromaticity: what colour the light itself is, which is CCT plus Duv and is covered in CCT, Duv and the black-body locus. On a colour-changing fitting both quantities move across the tuning range, which is why tunable white needs its rendering requirement stated at set points rather than once.
Correlated colour temperature is a separate axis. CCT says where the white sits between warm and cool. It says nothing about how well colours render. A 3000 K source and a 4000 K source can have identical Rf.
Duv — distance from the blackbody locus — is a third axis and it is the one that makes light look "wrong" in a way people cannot name. A source sitting noticeably above the locus appears green-tinted; below, pink. It is possible to have good Ra, correct CCT and still light a room that everyone dislikes, because Duv is off. It belongs in the specification alongside the others, and it appears in the note on colour consistency and SDCM.
What to write in the specification
- Ra minimum and R9 minimum, both as hard requirements rather than scored ones.
- Where colour appearance is commercially important, TM-30 Rf and Rg with the colour vector graphic supplied — most reputable manufacturers can now produce these on request.
- CCT with its tolerance expressed in SDCM, plus a Duv limit.
- Whether the figures are from the LED package datasheet or from the finished luminaire. Optics, diffusers and phosphor-loaded covers all shift the result, and the luminaire figure is the one that lights the room.
Sources and further reading
- IES TM-30, Method for Evaluating Light Source Color Rendition — the 99-sample method, Rf, Rg, hue-bin outputs and the colour vector graphic.
- CIE 13.3, Method of Measuring and Specifying Colour Rendering Properties of Light Sources — the definition of Ra and the R1–R15 test colour samples.
- CIE 224:2017 — the CIE fidelity index Rf, developed in parallel with TM-30.
- ANSI C78.377 — chromaticity specification for solid-state lighting, the source of the nominal CCT bins and Duv treatment.